 Connections
Research & Design • Treasure Data • 2016
Problem Data analysts must perform extremely technical, insecure, and non-transparent steps to bring data in from and out to their data sources in order to query in Treasure Data. They must follow documentation to create configuration files with secrets and use a CLI to set up their connections.
Opportunity Enable non-technical users to configure and monitor the transfer of their data easily and confidently in the Treasure Data’s web console.
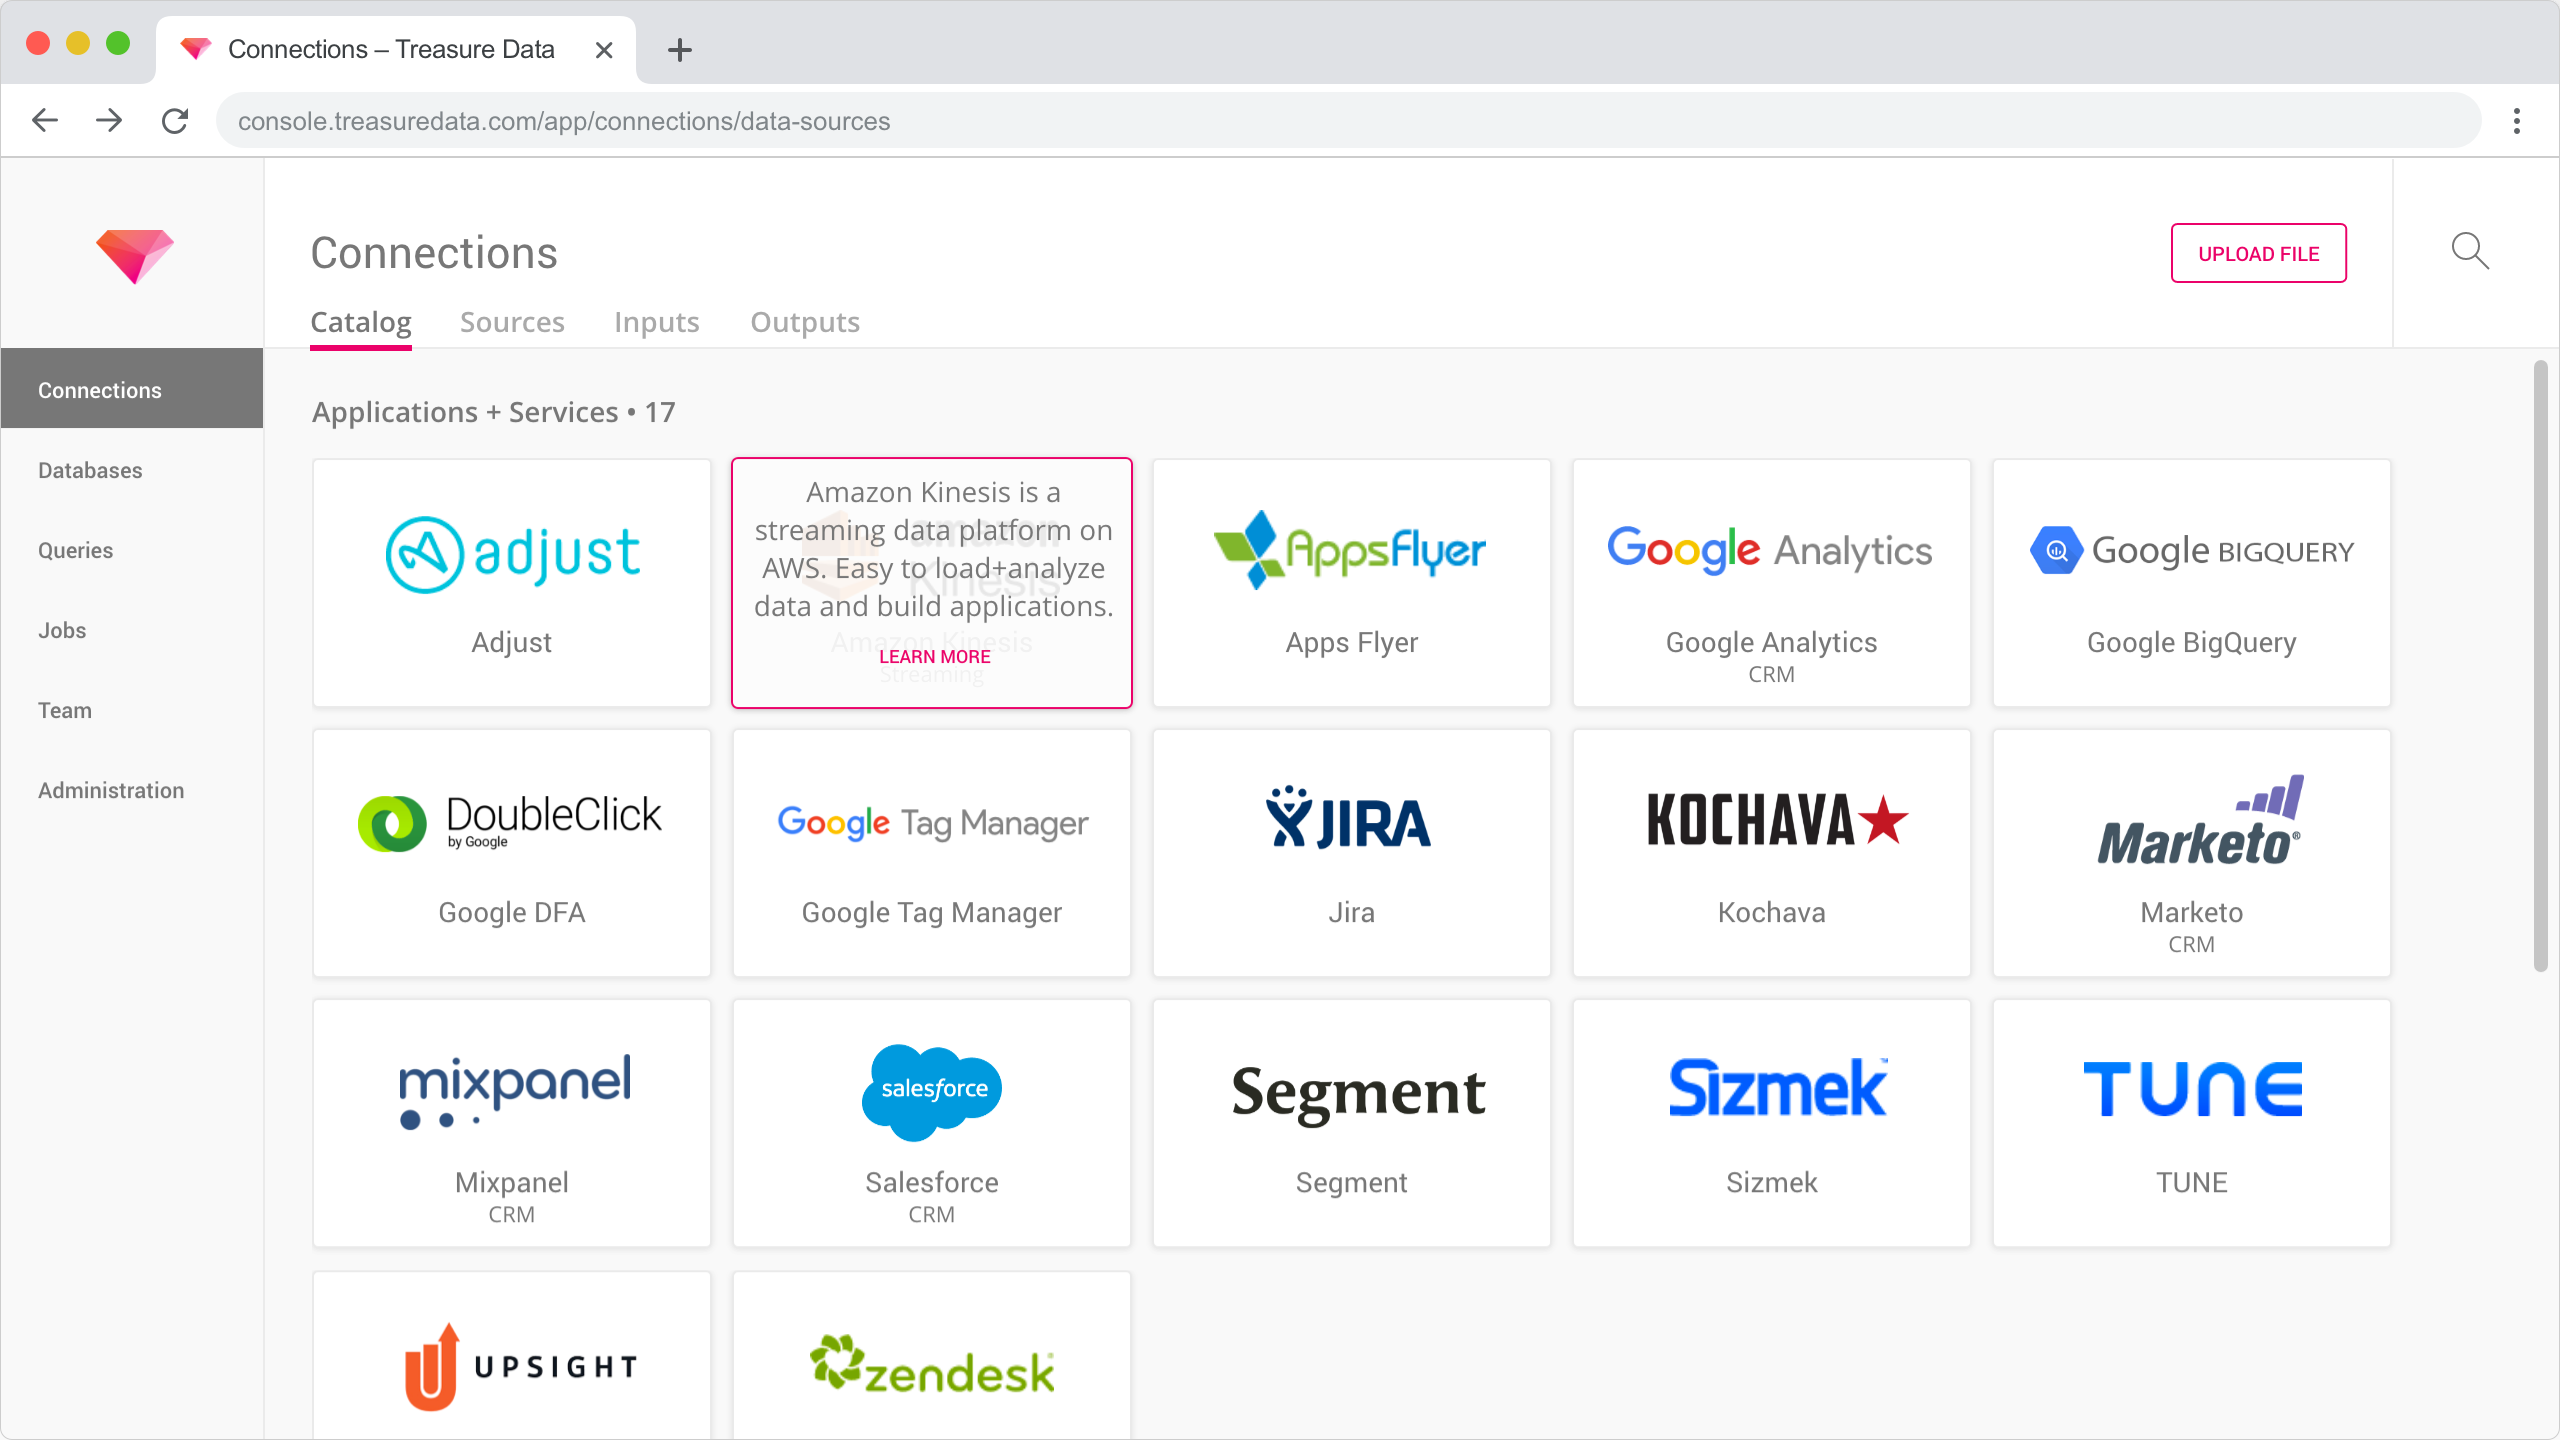
Solution Designed a new experience for analysts to browse a library of available connections, set up connections and data transfers with a wizard, and monitor active input and output data transfers.
Tasks Support a team of 4 DEVs and 1 PM by researching existing connections and their configurations, card sorting connection types, exploring workflows with paper sketches, conducting 3 user interviews, iterating on information architecture to balance technical constraints and user feedback, delivering high-fidelity mockups with Adobe XD.
Problems
Data analysts use Treasure Data to ingest their data from any source and query with a familiar SQL-like language. However, in order to connect and transfer their data in and out of Treasure Data, they are guided by documentation to follow a multi-step process that’s extremely technical, insecure, and non-transparent guided by documentation.
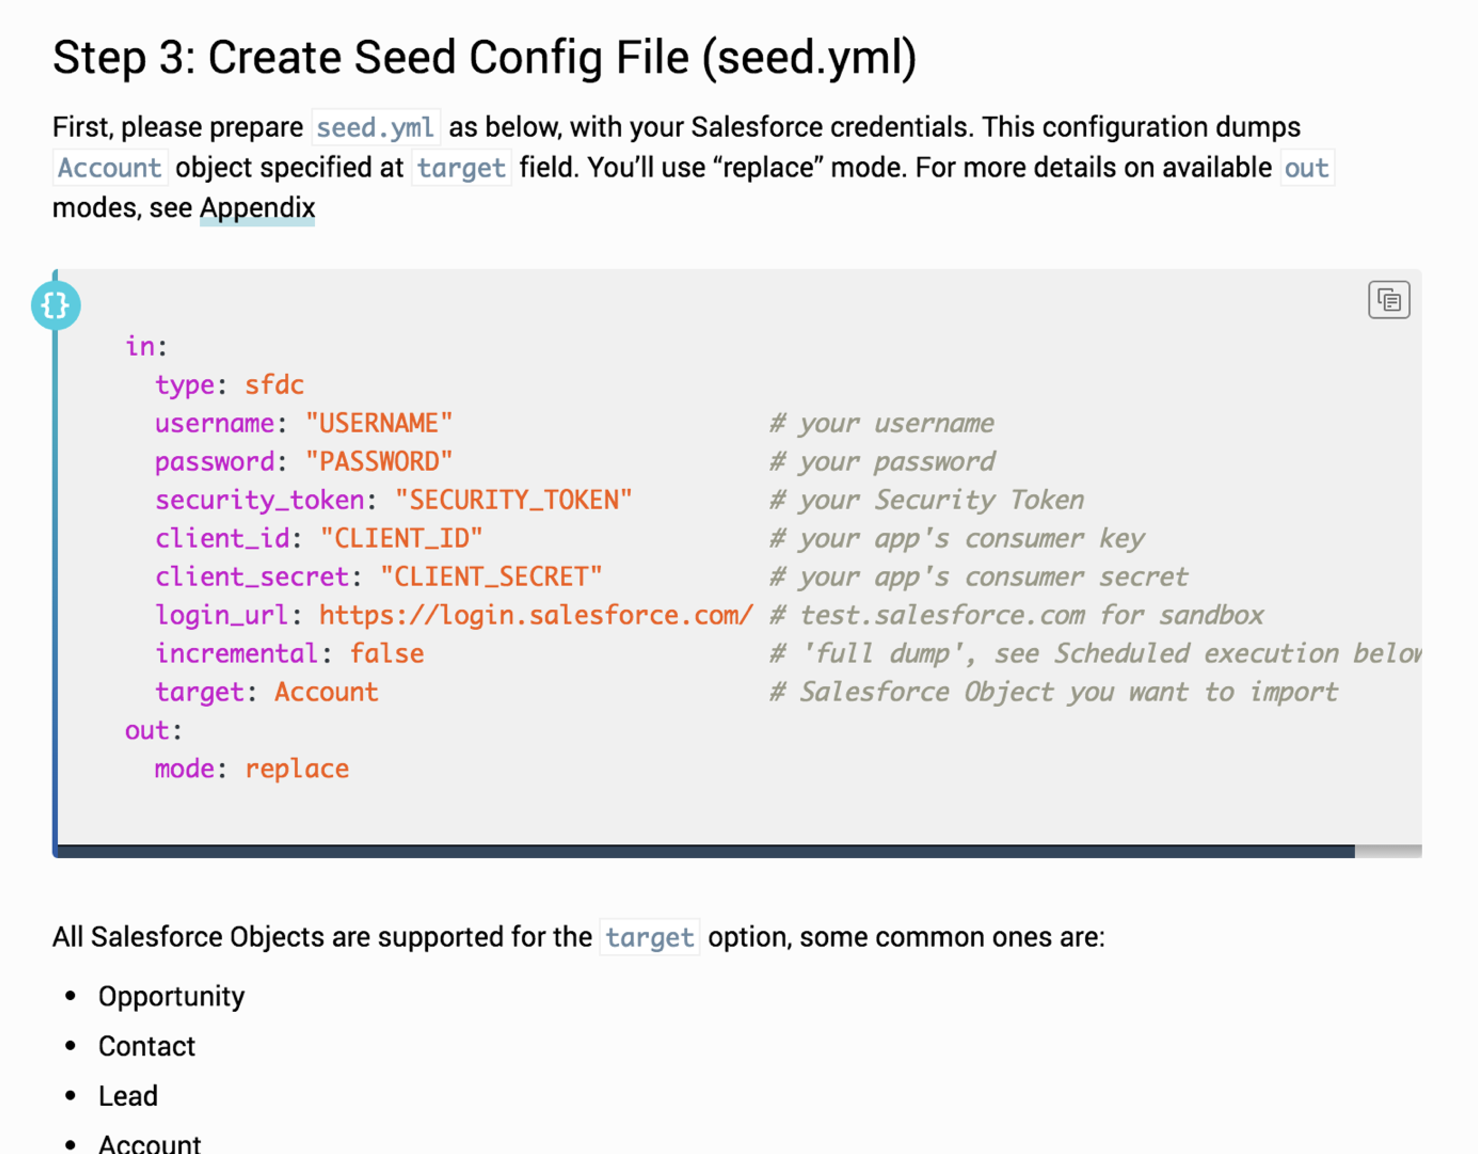
They must create configuration files with exposed credentials such as passwords, tokens, and secrets. Then they must run queries on a command line interface (CLI) with no clear indication of success. Finally, they are required to actively run queries to monitor the status of any active or scheduled data transfers, rather than passively receiving information.
Opportunity
How might we improve Treasure Data for non-technical data analysts to configure and monitor the transfer of their data easily, securely, and confidently?
Explore
Requirements were set by the product manager to allow users to browse/search available connections, to submit and test credentials, and monitor live data transfers. Given the complex nature of setting up connections, I chose early on to utilize progressive disclosure, frequent validation, assistance, and simplified language.
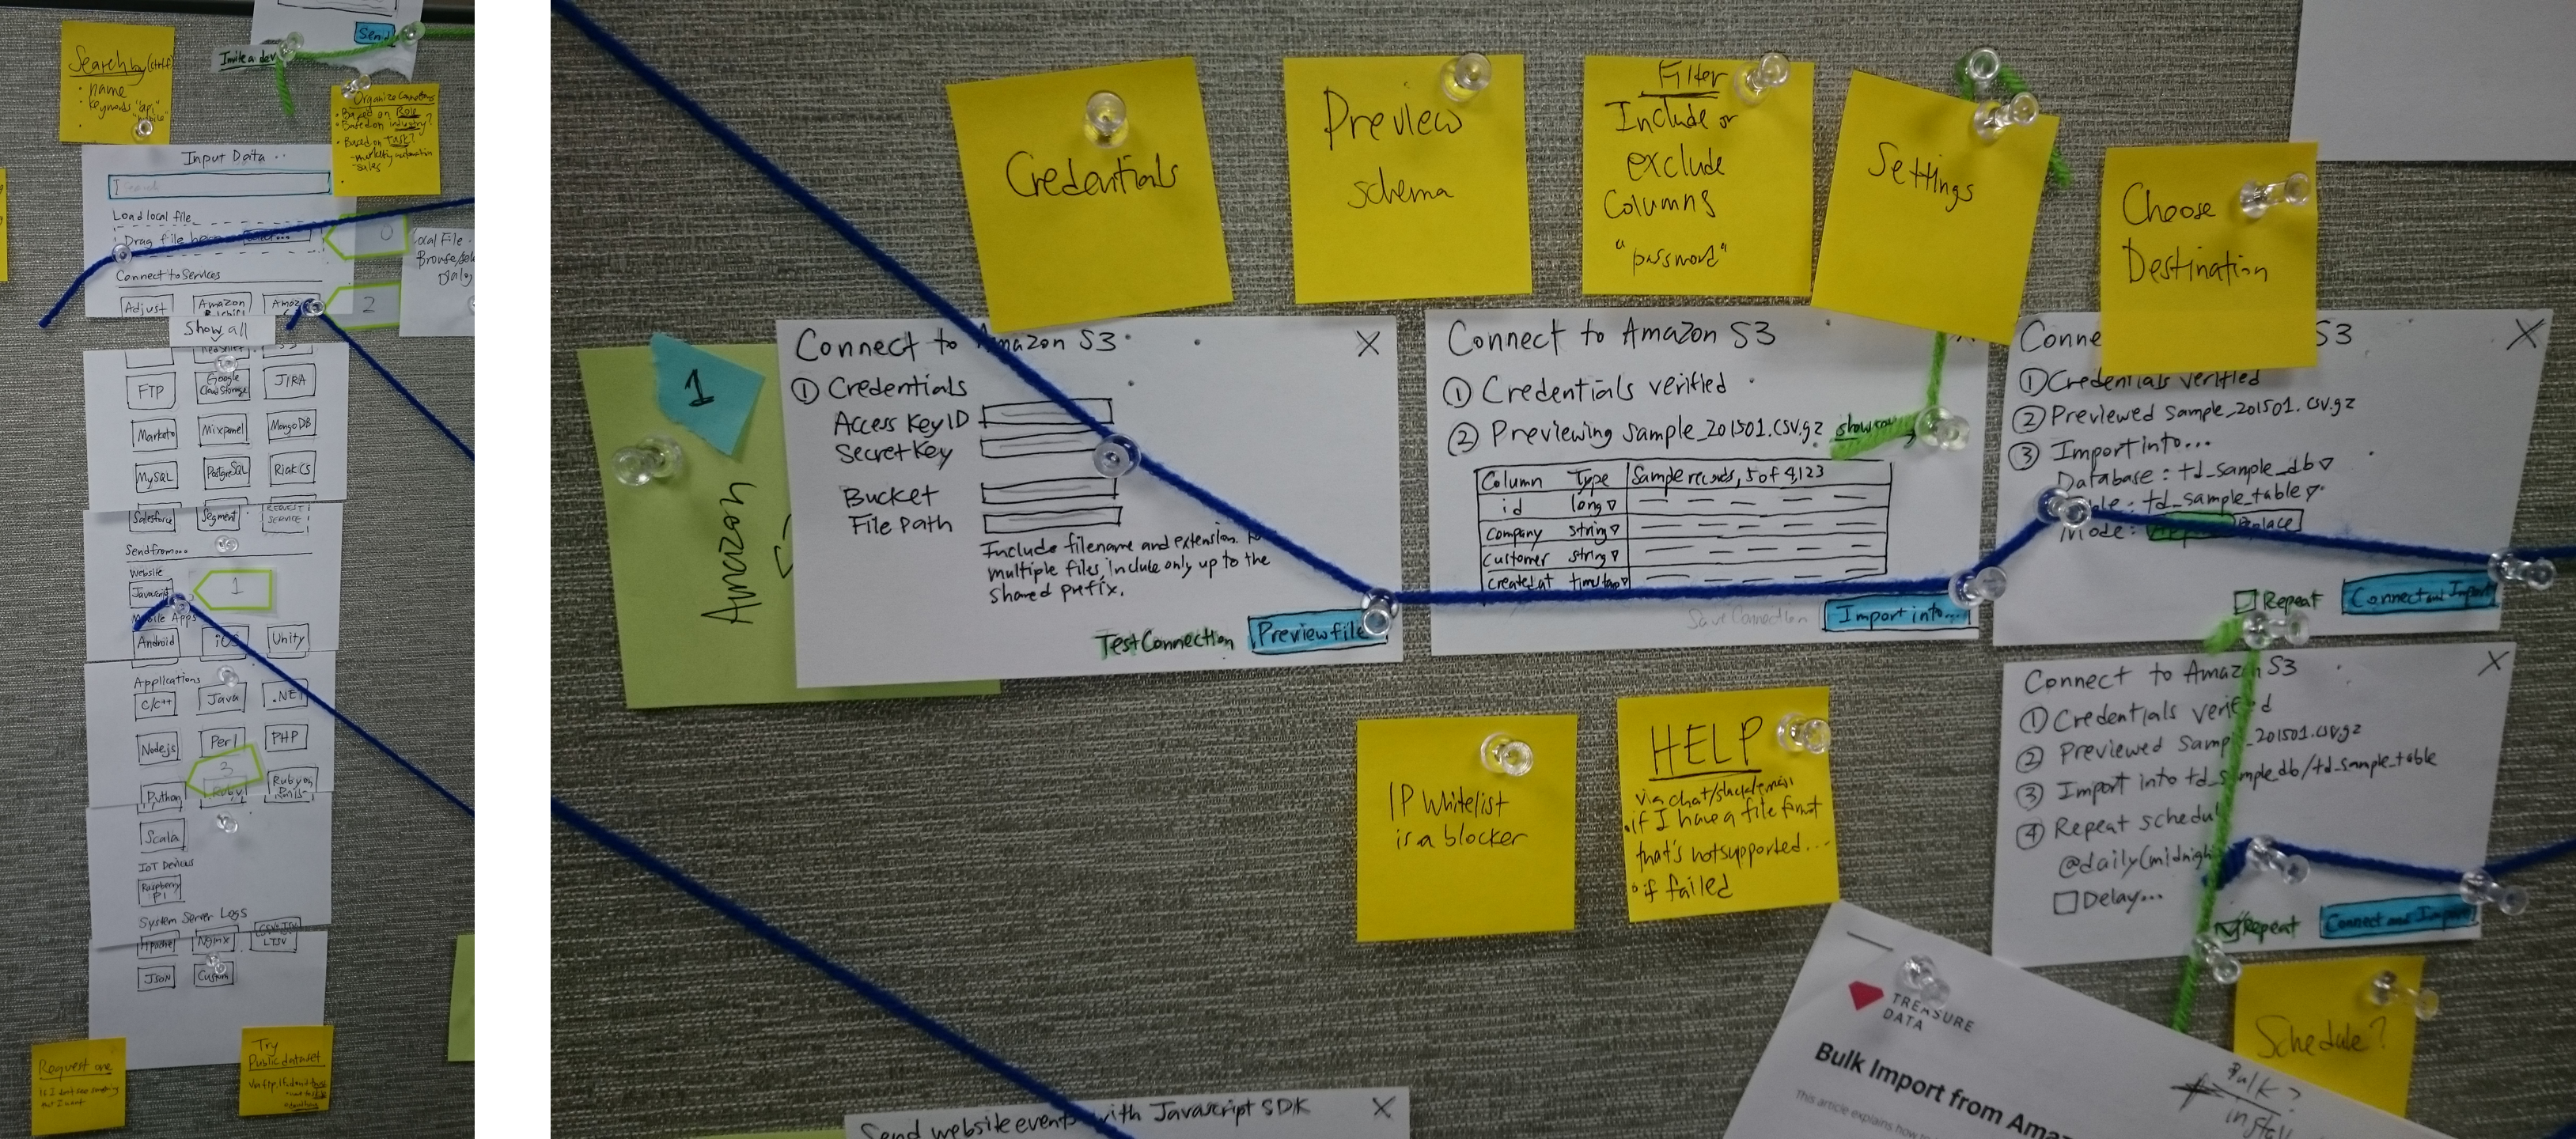
Given the technical nature of the project, I chose to use paper sketches and notes to illustrate the sequence of user tasks, with the hope for a public and agile collaboration with front-end and back-end developers.
To get a rough feel for the workflow, I stitched together photos of the paper mockups into click-through prototypes using Adobe XD. I compared alternatives for the arrangement of fields (single page vs wizard), default values, editing advanced settings, and the fidelity of verification required (summary, schema or data preview).
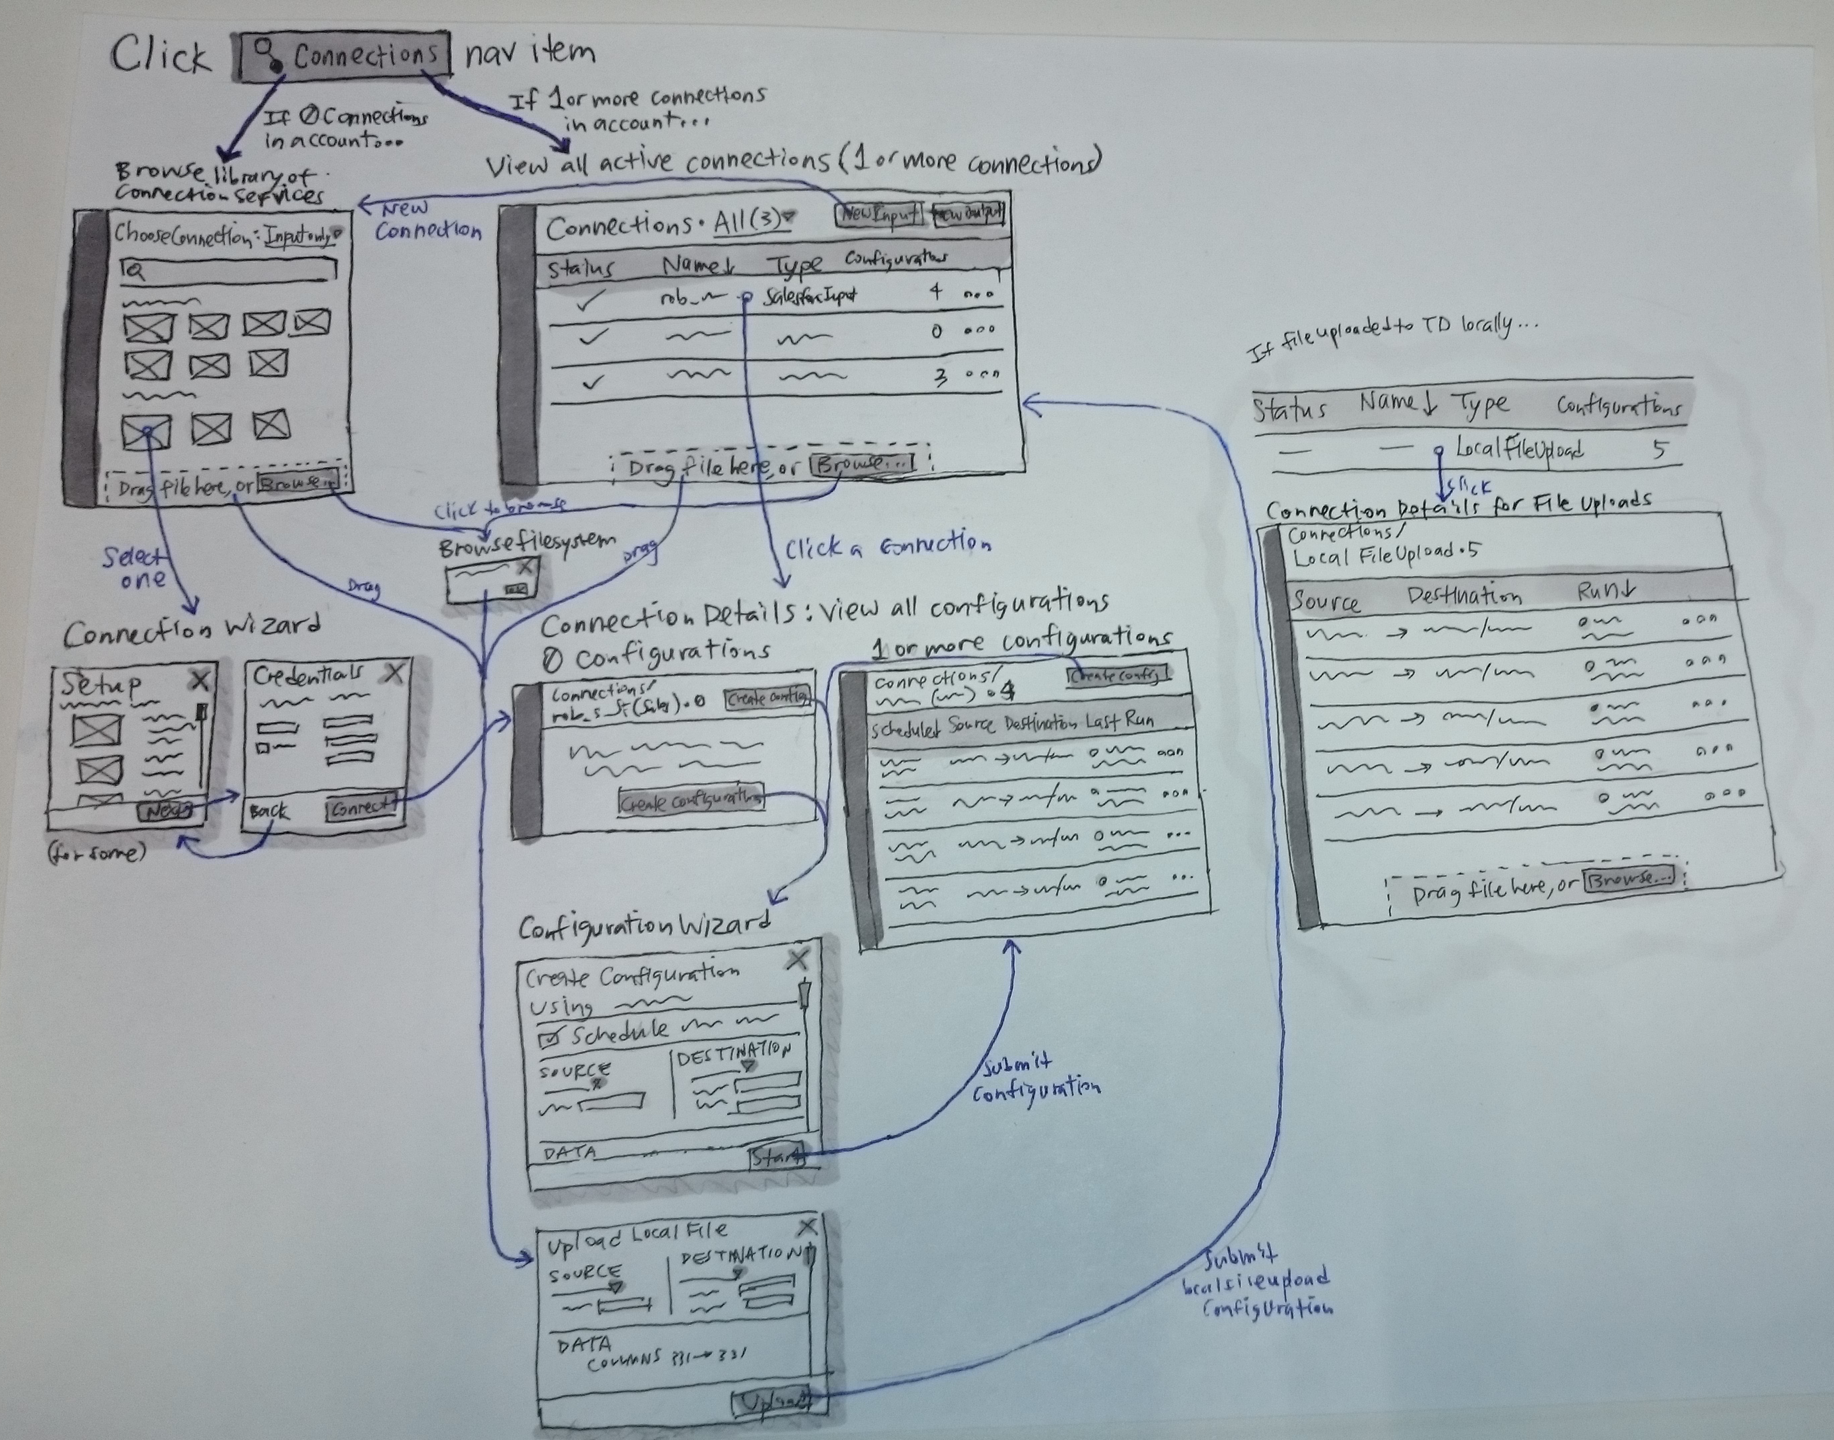
After exploring a few directions for the general workflow and information architecture, I decided a design direction to adapt to the user’s experience: first-time vs mature user. A first-time user would browse a connections library while a mature user with existing connections would view a monitoring table. Also, the setup was split into two wizards (connection setup and configuration setup) given technical constraints.
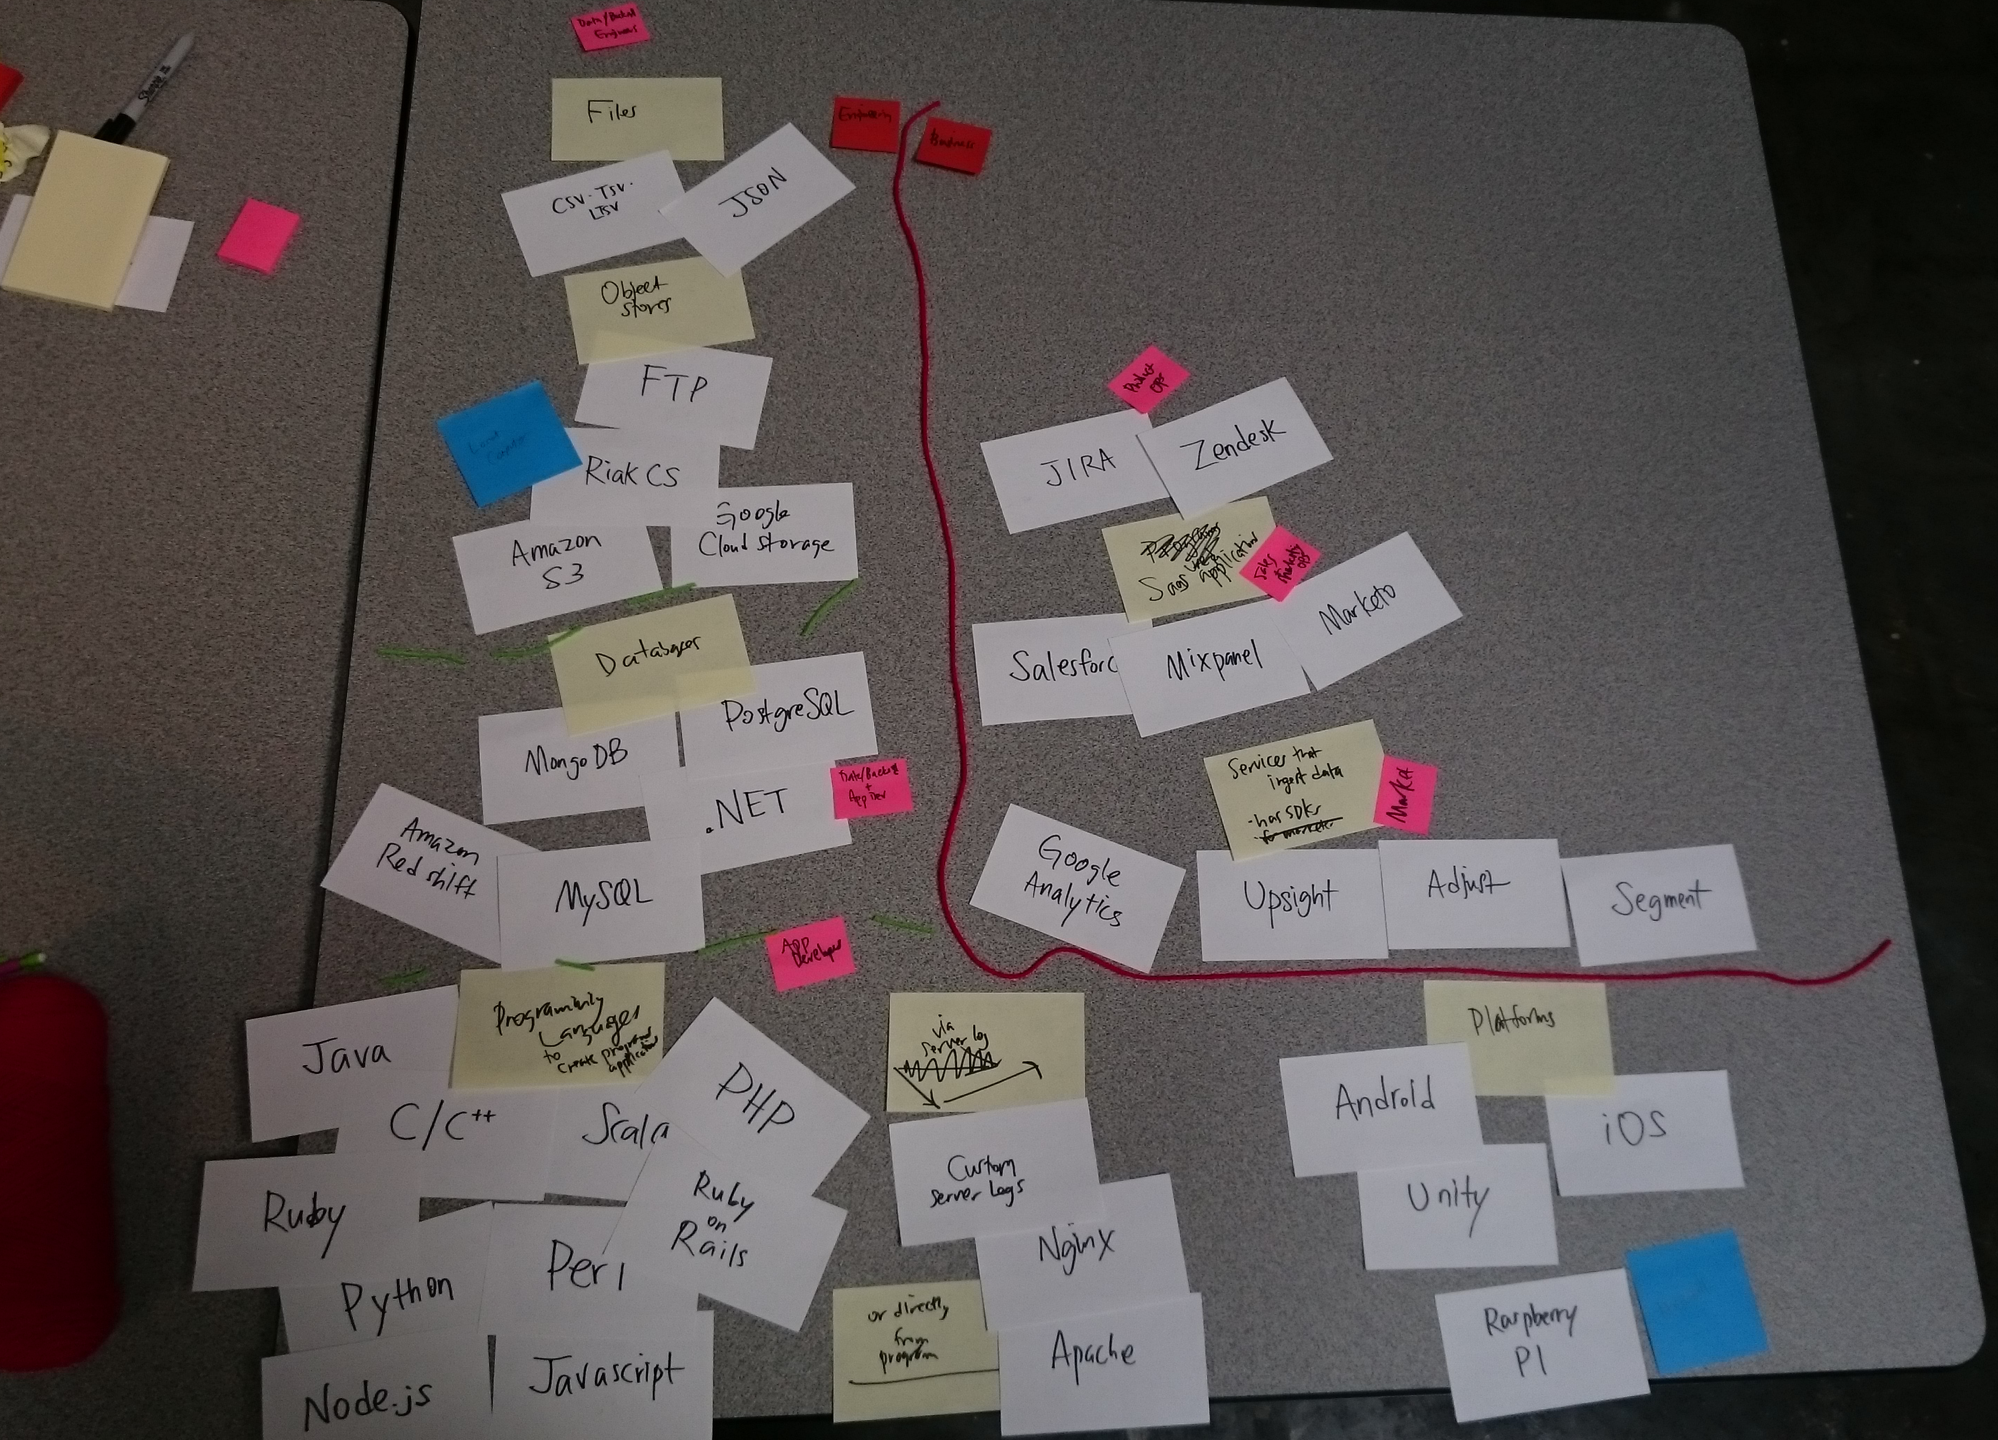
I also performed a card sorting exercise with eight stakeholders and three users to organize connection types. The results were used to better categorize connections in the library, our marketing website, and product documentation.
Converge & Test
I built a higher fidelity click-through prototype incorporated filters by source type in the library, single-page forms, validation states in the setup, connection verification, scheduling options, and monitoring a rollup of multiple transfers from a single connection.
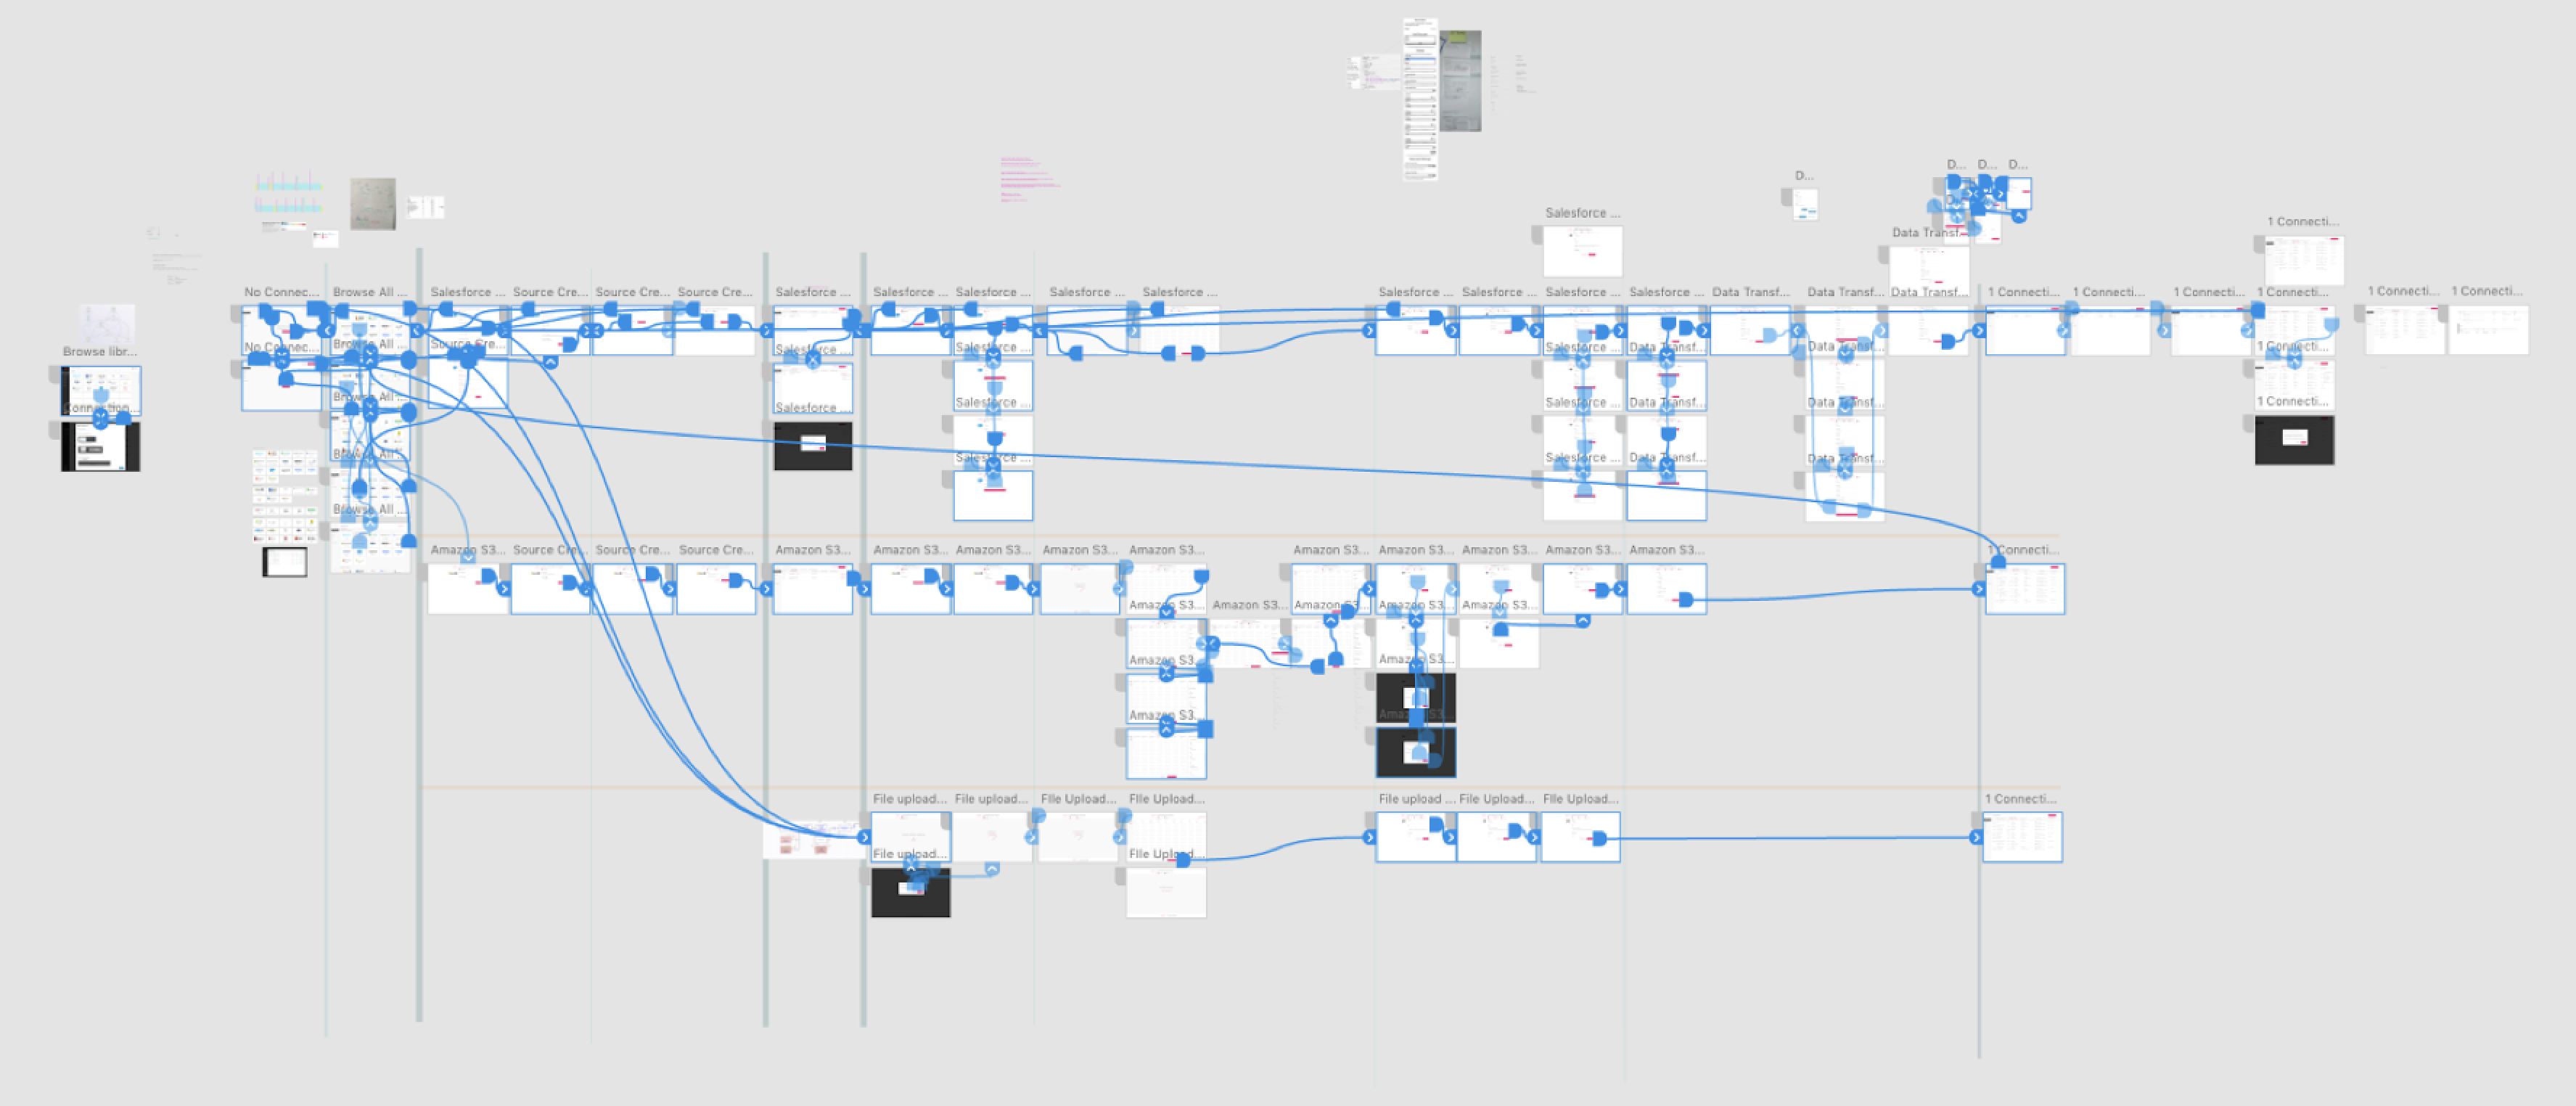
A behind the scenes look shows the various artboards wired together in Adobe XD. To focus the prototype, I chose three setup experiences for people to get a feel for: Salesforce, Amazon S3, and local file upload.
After testing with 3 users, they expected a wizard experience, needed a data preview to help verify a successful data transfer configuration, and preferred a separation or filtering by input or output transfers. Also, internal stakeholders saw this feature as an opportunity to showcase our connections catalog as a landing page rather than hiding it in a modal. Developers provided feedback on the difficulty in building a rollup of transfers with connections.
Iterate
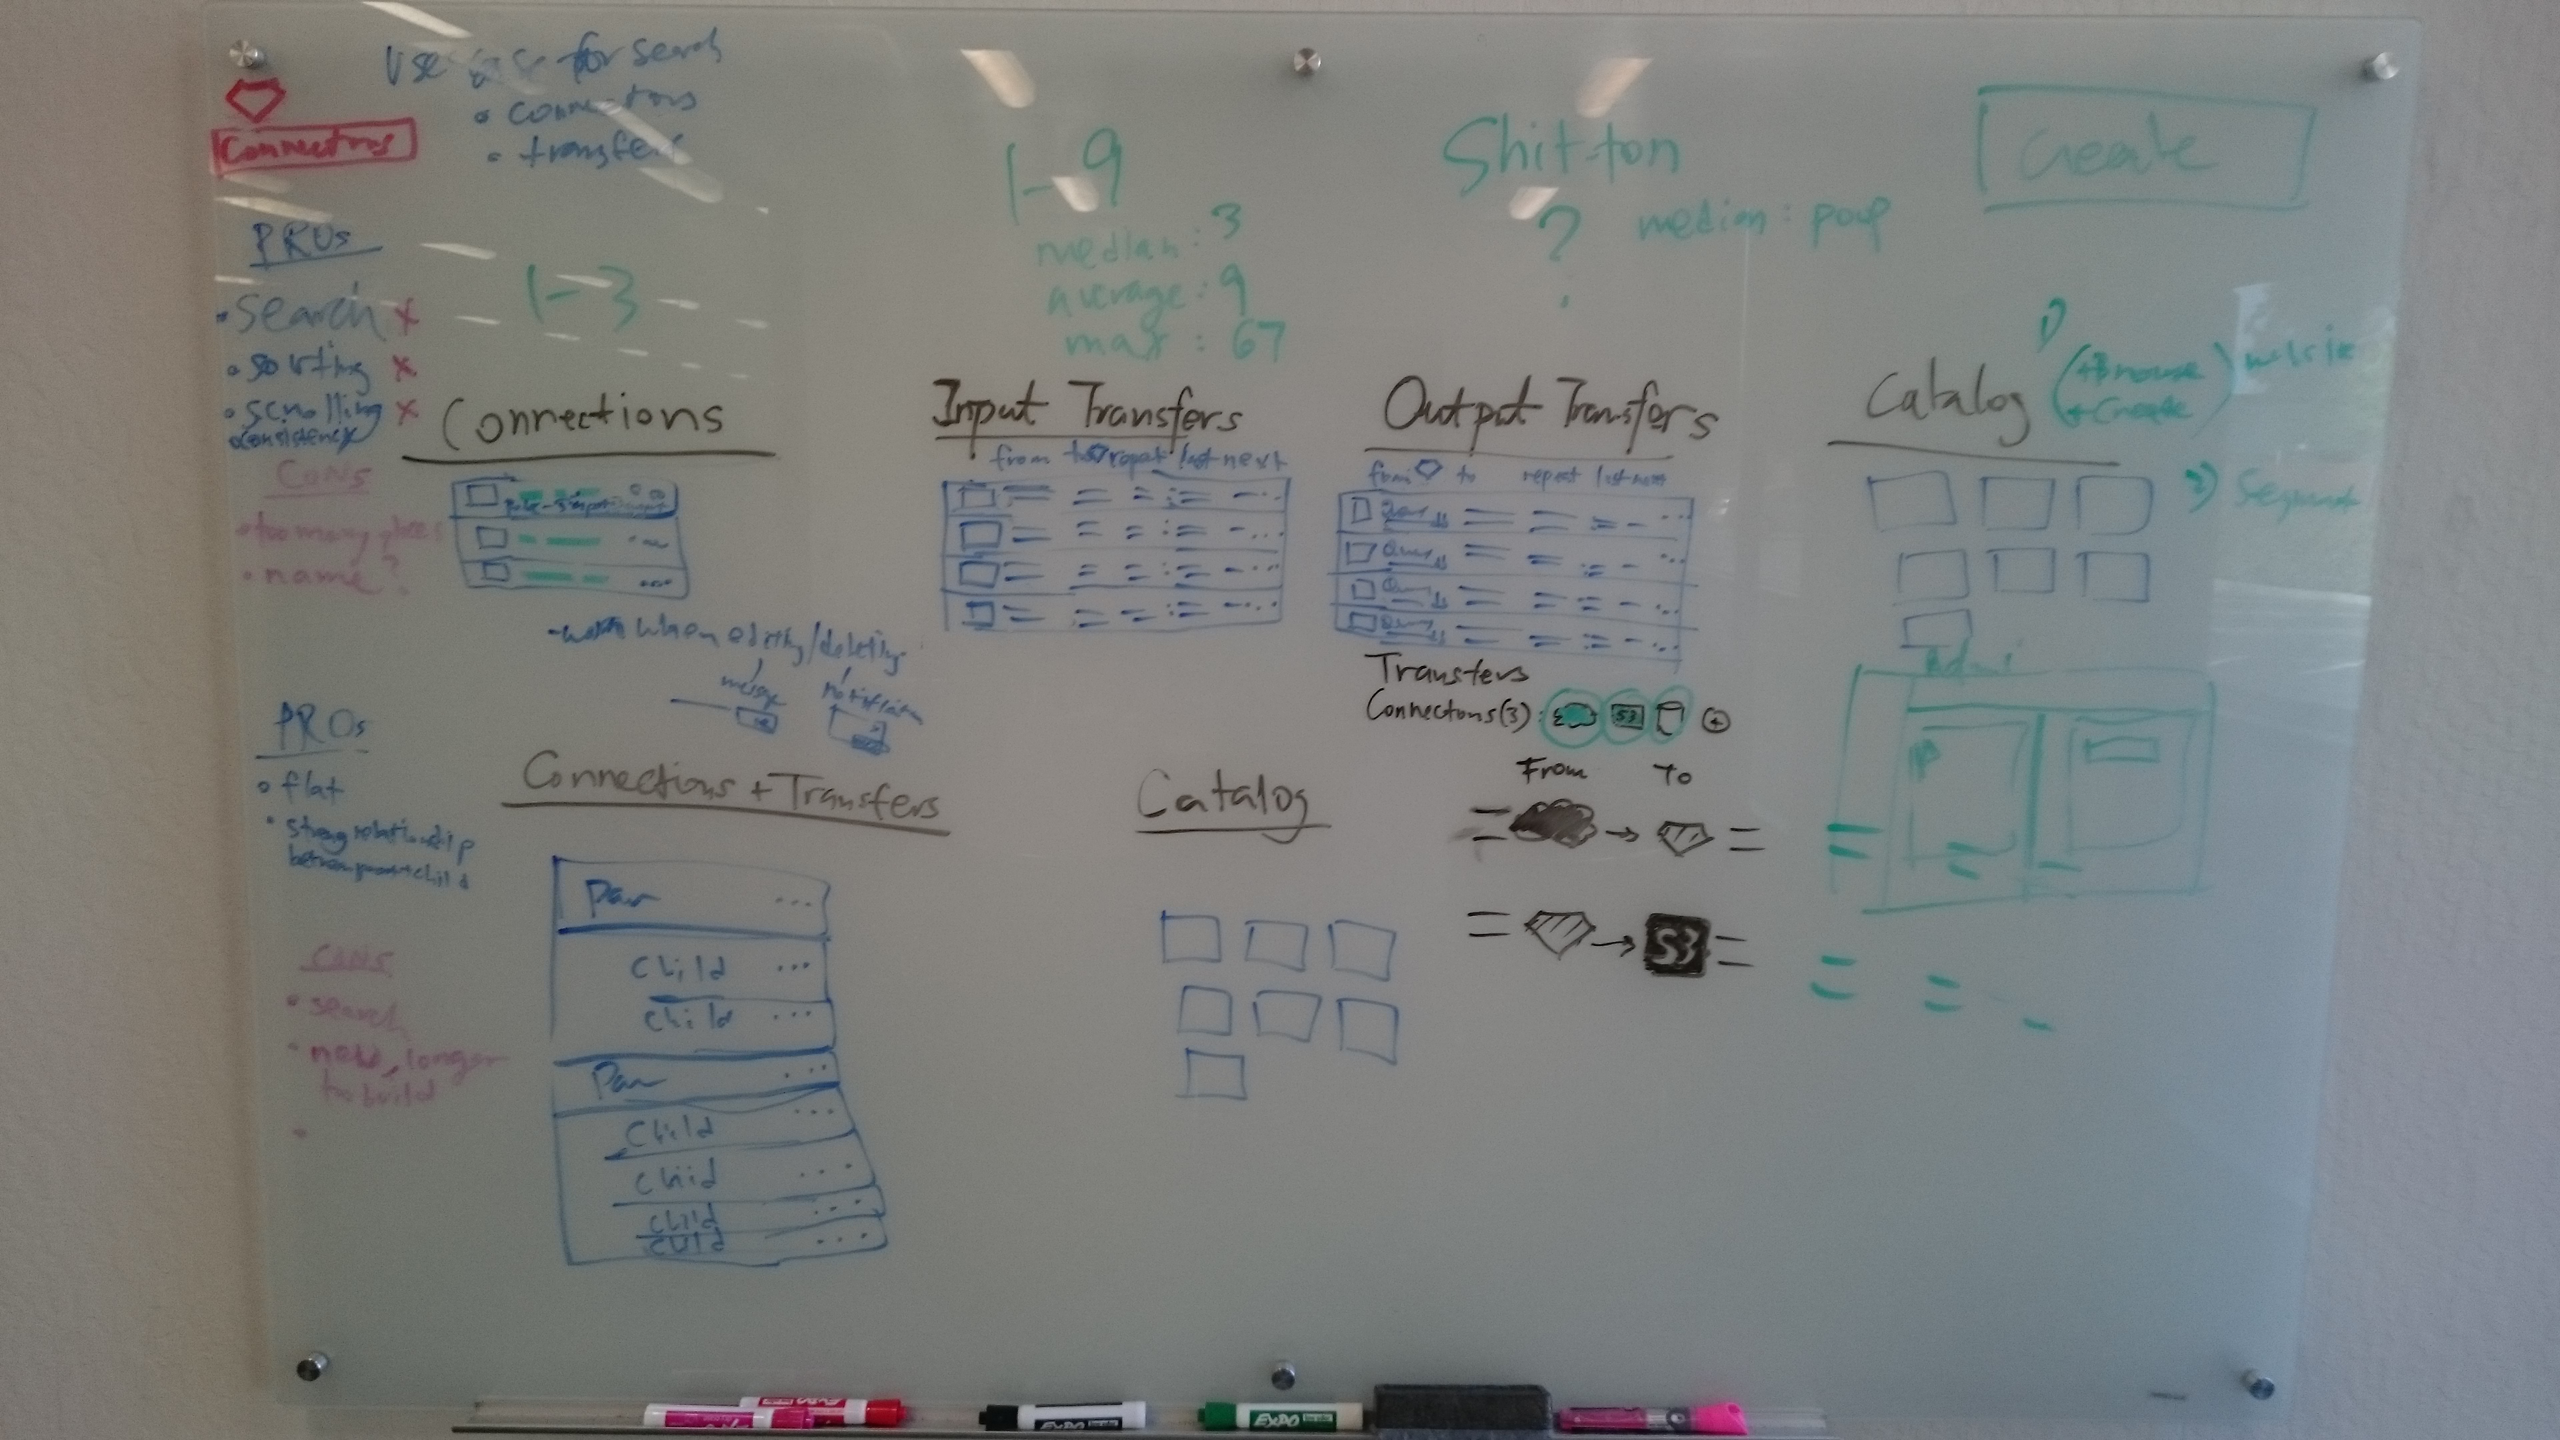
Back to the whiteboard! The information architecture of the setup and monitoring were reworked given technical constraints and to align with users’ mental model. As an MVP, users will separately monitor between the connections, input transfers, and output transfers.
Solution
After a dozen more iterations, the final solution combines various decisions to browse a connections catalog page, multi-step wizards, a data preview, and a separation of viewing sources, inputs, and outputs.